Skip to content

General Studies Paper II (CSAT) 2018

Set A

Questions 61–80 of 80

61Quantitative Aptitude • Time and Work
Easy

Consider the following graph :
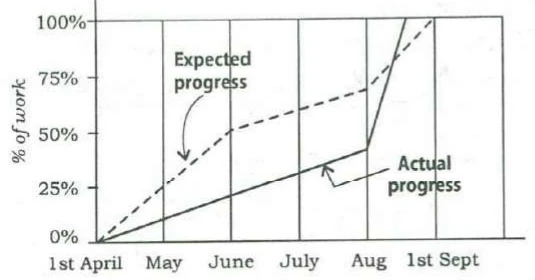
A line graph. Vertical axis: % of work, marked 0%, 25%, 50%, 75%, 100%. Horizontal axis marked 1st April, May, June, July, Aug, 1st Sept, with a vertical gridline at each. A dashed line labelled Expected progress runs through about 0% at 1st April, 25% at May, 50% at June, 60% at July, 70% at Aug, and 100% at 1st Sept. A solid line labelled Actual progress rises steadily through about 0% at 1st April, 10% at May, 20% at June, 31% at July and 42% at Aug, then rises steeply, crossing the dashed line at about 80%, to reach 100% roughly midway between Aug and 1st Sept. Values other than those on the gridlines are read by eye.

Which one of the following statements is not correct with reference to the graph given above?

Options
Show answer & solution

Option D

During the period from 1st April to 1st September, at no time was the actual progress more than the expected progress.

Why

The question asks for the statement that is NOT correct. On 1st June the actual line is near 20% and the expected line is at 50%, so A is correct. The actual line is steepest after the Aug mark, so B is correct. The actual line reaches 100% before 1st Sept, the expected finish, so C is correct. But in August the actual line crosses above the expected line, at about 80%, and stays above it until the work ends. So for a while actual progress was ahead of expected, and D is wrong.

Proof

After the Aug mark the solid line crosses above the dashed line and reaches 100% before the dashed line does.

About the other options

Option A

True: about 20% done on 1st June against 50% expected.

Option B

True: the actual line is steepest between the Aug mark and 1st Sept.

Option C

True: the actual line reaches 100% before 1st Sept.
Ideal time: about 50 s
62Quantitative Aptitude • Permutations and Combinations
Easy

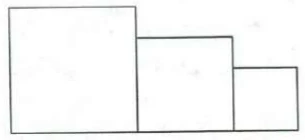
For a sports meet, a winners' stand comprising three wooden blocks is in the following form :

Three rectangular blocks side by side on a common base, in decreasing height from left to right: a tall block, a medium block, and a short block. Each block shows one front face. No labels.

There are six different colours available to choose from and each of the three wooden blocks is to be painted such that no two of them has the same colour. In how many different ways can the winners' stand be painted?

Options
Show answer & solution

Option A

120

Approach

The three blocks are different (tall, middle, short), so colour them one at a time and multiply the choices.

Step-by-step solution

  1. 1
    Tallest block: 6 colours to choose from.
  2. 2
    Middle block: 5 colours left. Shortest block: 4 colours left.

    Why: No two blocks may share a colour, so each block uses up one colour.

  3. 3

    Why: Every choice for one block goes with every choice for the next.

Common mistakes

Option B

; no counting of colours and blocks gives it.

Option C

No counting of 6 colours on 3 blocks gives 66.

Option D

lets two blocks share a colour and leaves out the third block.

Skills used

Ideal time: about 30 s
63Quantitative Aptitude • Percentages • Population and Growth
Easy

Directions for the following 2 (two) items :

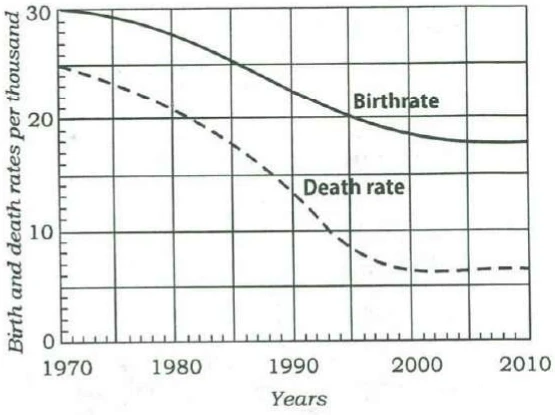
Consider the following graph in which the birthrate and death rate of a country are given, and answer the two items that follow.

A line graph. Vertical axis: Birth and death rates per thousand, from 0 to 30, labelled at 0, 10, 20, 30 with gridlines every 5. Horizontal axis: Years, labelled 1970, 1980, 1990, 2000, 2010, with gridlines every 5 years and minor ticks each year. A solid curve labelled Birthrate falls smoothly through about 30 (1970), 29.5 (1975), 28 (1980), 25.5 (1985), 22.5 (1990), 20 (1995), 18.5 (2000), 18 (2005), 18 (2010), flattening after about 2005. A dashed curve labelled Death rate falls through about 25 (1970), 23 (1975), 21 (1980), 17.5 (1985), 13.5 (1990), 8.5 (1995), 6.5 (2000), 6.5 (2005), 7 (2010), flattening after about 2000. Values are read by eye at the gridlines.

Looking at the graph, it can be inferred that from 1990 to 2010

Options
Show answer & solution

Option D

population growth rate shows no trend

Why

The population growth rate is the birth rate minus the death rate. From the graph the gap is about 8 per thousand in 1990, rises to about 12 in 2000, then narrows to about 11 by 2010 as the death rate turns up slightly. The growth rate rises and then falls over the period, so it follows no single trend. Comparing only 1990 with 2010, the gap grew from about 8 to 11, so A is also defensible.

Proof

Gap, per thousand: about 8 in 1990, 11.5 in 1995, 12 in 2000, 11.5 in 2005, 11 in 2010.

About the other options

Option A

Also defensible

Defensible if only 1990 and 2010 are compared: the gap grew from about 8 to 11. But it peaked in 2000 and narrowed after, so the official key finds no single trend.

Option B

Holds only after 2000; before that the gap widens sharply.

Option C

The gap moves from about 8 to 12 and back to 11, so it is not stable.

Ideal time: about 45 s
64Quantitative Aptitude • Percentages • Population and Growth
Easy

Same directions as Q63

With reference to the above graph, consider the following statements considering 1970 as base year :

1
Population has stabilized after 35 years.
2
Population growth rate has stabilized after 35 years.
3
Death rate has fallen by 10% in the first 10 years.
4
Birthrate has stabilized after 35 years.

Which of the above are the most logical and rational statements that can be made from the above graph?

Options
Show answer & solution

Option D

2 and 4

Why

Counting 35 years from 1970 brings us to 2005. 1: Wrong. After 2005 births (about 18 per thousand) still exceed deaths (about 7), so the population keeps growing. 2: Right. After 2005 both curves are flat, so the gap between them, the growth rate, stays near 11 per thousand. 3: Wrong. From 1970 to 1980 the death rate fell from about 25 to about 21: a fall of 4 out of 25, about 16%, not 10%. 4: Right. The birth rate curve is flat at about 18 after 2005.

Proof

1970 + 35 = 2005. After 2005: birth rate about 18, death rate about 6.5 to 7, both flat. Death rate 1970 to 1980: 25 to 21, a fall of 16%.

About the other options

Option A

Statement 1 is wrong: a steady positive growth rate means the population is still rising.

Option B

Statements 1 and 3 are wrong; the death rate fell by about 16% in the first ten years.

Option C

Statement 3 is wrong: 25 to 21 is a fall of about 16%.

Ideal time: about 1 min
65Quantitative Aptitude • Linear Equations
Easy

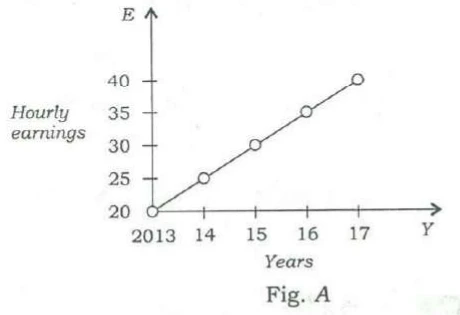
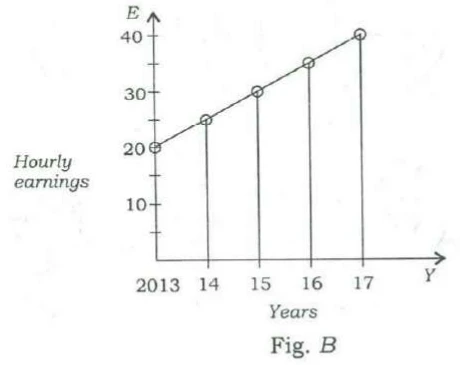
Average hourly earnings per year () of the workers in a firm are represented in figures and as follows :

Fig. A: a line graph. Vertical axis E, Hourly earnings, marked 20, 25, 30, 35, 40, with the origin at 20. Horizontal axis Y, Years, marked 2013, 14, 15, 16, 17. Open circles joined by a straight line at 2013: 20, 14: 25, 15: 30, 16: 35, 17: 40.
Fig. B: a line graph. Vertical axis E, Hourly earnings, from 0, marked 10, 20, 30, 40 with minor ticks between. Horizontal axis Y, Years, marked 2013, 14, 15, 16, 17. Open circles joined by a straight line at 2013: 20, 14: 25, 15: 30, 16: 35, 17: 40, with a vertical line dropped from each point at 14 to 17 to the horizontal axis.

From the figures, it is observed that the

Options
Show answer & solution

Option C

slopes of the graphs are same

Why

Both figures plot the same five points: is 20, 25, 30, 35, 40 for 2013 to 2017. Figure starts its scale at 20 and figure at 0, so line only looks steeper. The real slope is the rise in for each year, and that is 5 in both. So the slopes are the same.

Proof

Slope a year in both figures.

About the other options

Option A

The values are the same in both figures: 20, 25, 30, 35, 40.

Option B

Both ranges are 40 − 20 = 20.

Option D

Both rise by 5 a year; only the vertical scale differs, which makes A look steeper.

Ideal time: about 45 s
66Logical Reasoning • Visual Reasoning
Easy

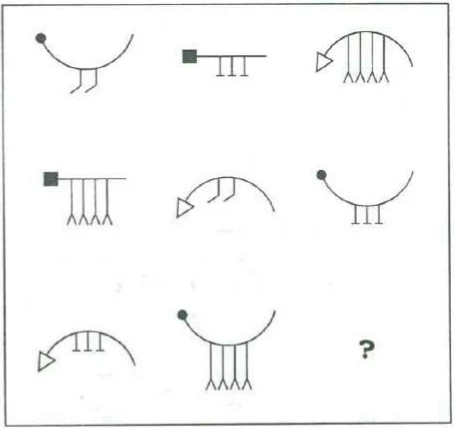
Consider the figures given below :

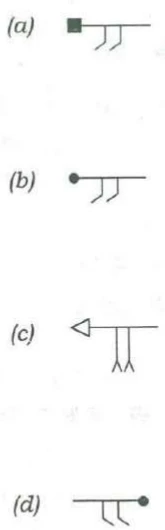
A boxed 3 by 3 grid of line figures, the last cell holding a question mark. Each figure is a head attached to the left end of a body, with appendages hanging from the body. Heads: a filled circle, a filled square, or an open triangle pointing left. Bodies: an arc open upward (a U), a straight horizontal line, or an arc open downward (a dome). Appendages: two short legs bent at the foot like hooks, three short legs each ending in a flat crossbar, or four long legs each ending in a forked foot. Row 1: circle head, U arc, two hooked legs; square head, straight line, three crossbar legs; triangle head, dome arc, four forked legs. Row 2: square head, straight line, four forked legs; triangle head, dome arc, two hooked legs; circle head, U arc, three crossbar legs. Row 3: triangle head, dome arc, three crossbar legs; circle head, U arc, four forked legs; ?.

To fit the question mark, the correct answer is

The four answer figures, labelled (a) to (d). (a): filled square head at the left end of a straight line, two hooked legs below. (b): filled circle head at the left end of a straight line, two hooked legs below. (c): open triangle head pointing left at the left end of a straight line, two long legs with forked feet below. (d): a straight line with a filled circle head at its right end, two hooked legs below with the hooks bent the opposite way to (a) and (b).
Options
Show answer & solution

Option A

Figure (a)

Why

Each figure has a head, a body and legs. Heads: circle, square or triangle. Bodies: a U-shaped curve, a straight line, or a dome. Legs: two hooked, three with crossbars, or four forked. The head always goes with the same body: circle with the U-curve, square with the straight line, triangle with the dome. In every row and every column each kind of head and each kind of legs appears once. Row 3 already has the triangle and the circle, so the missing figure has a square head on a straight line. Row 3 already has crossbar legs and forked legs, so the missing legs are the two hooked ones.

Proof

Missing figure: square head at the left end of a straight line, two hooked legs. That is figure (a).

About the other options

Option B

The circle head is already in row 3, and a circle goes with a U-shaped body, not a straight line.

Option C

The triangle head and forked legs are both already in row 3.

Option D

A circle head, already in row 3, and placed at the right end, while every figure has its head on the left.

Ideal time: about 1 min
67Quantitative Aptitude • Profit, Loss and Discount
Easy

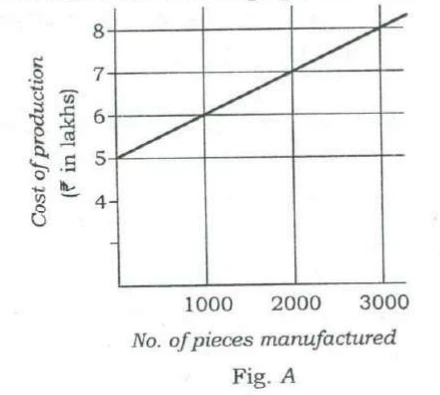
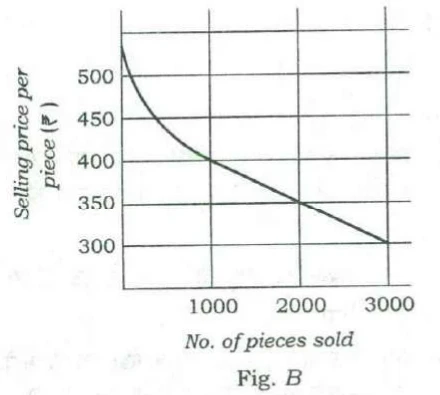
Consider the following figures A and B :

Fig. A: a line graph. Vertical axis: Cost of production (₹ in lakhs), marked 4, 5, 6, 7, 8, with one unmarked tick below 4. Horizontal axis: No. of pieces manufactured, marked 1000, 2000, 3000, with gridlines. A straight line passes through 5 at 0 pieces, 6 at 1000, 7 at 2000 and 8 at 3000, continuing slightly beyond 3000.
Fig. B: a graph. Vertical axis: Selling price per piece (₹), marked 300, 350, 400, 450, 500. Horizontal axis: No. of pieces sold, marked 1000, 2000, 3000, with gridlines. A curve starts at about 540 at 0 pieces, falls steeply and then less steeply to 400 at 1000, then runs as a straight line through 350 at 2000 to 300 at 3000.

The manufacturing cost and projected sales for a product are shown in the above figures A and B respectively. What is the minimum number of pieces that should be manufactured to avoid a loss?

Options
Show answer & solution

Option A

2000

Approach

No loss means the money from selling the pieces is at least the cost of making them; compare the two at each number, taking every piece made as sold.

Step-by-step solution

  1. 1
    Cost from Fig. : ₹5 lakh at 0 pieces, up ₹1 lakh for every 1000. So ₹6, ₹7 and ₹8 lakh at 1000, 2000 and 3000 pieces.
  2. 2
    Money from sales = pieces price per piece from Fig. . At 1000: , ₹4 lakh. At 2000: , ₹7 lakh. At 3000: , ₹9 lakh.

    Why: Fig. gives the price of one piece, not the total, so multiply by the number of pieces.

  3. 3
    1000: ₹4 lakh against ₹6 lakh, a loss. 2000: ₹7 lakh against ₹7 lakh, no loss. 3000: ₹9 lakh against ₹8 lakh, a profit.

    Why: No loss starts where sales money first equals the cost.

  4. 4
    Below 2000 the price rises by ₹5 for every 100 fewer pieces. At 1500: , ₹5.625 lakh, against ₹6.5 lakh. At 1900: , ₹6.745 lakh, against ₹6.9 lakh. Both are losses.

    Why: For the least number, every smaller number must still make a loss.

Common mistakes

Option B

Stops at a number that clearly makes a profit and does not check 2000, where sales just cover the cost.

Option C

Looks for a profit instead of no loss; at 2000 there is already no loss.

Option D

Lies beyond both graphs, which end at 3000 pieces.

Skills used

Ideal time: about 1.5 min
68Quantitative Aptitude • Ratio and Proportion
Easy

A lift has the capacity of 18 adults or 30 children. How many children can board the lift with 12 adults?

Options
Show answer & solution

Option B

10

Approach

Treat a full lift as one whole and find how much of it the 12 adults use.

Step-by-step solution

  1. 1
    Each adult uses of the lift, so 12 adults use .

    Why: 18 adults fill it exactly.

  2. 2
    Left: of the lift.
  3. 3
    children.

    Why: A whole lift holds 30 children.

Common mistakes

Option A

Takes spare adult places and counts them as 6 children.

Option C

Takes , as if one adult took the room of one child.

Option D

Takes half the lift as free, ; the adults fill two-thirds, not half.

Skills used

Ideal time: about 30 s
69Quantitative Aptitude • Simple and Compound Interest
Easy

A person bought a refrigerator worth ₹ 22,800 with 12.5% interest compounded yearly. At the end of first year he paid ₹ 8,650 and at the end of second year ₹ 9,125. How much will he have to pay at the end of third year to clear the debt?

Options
Show answer & solution

Option D

₹ 11,250

Approach

Go year by year: add the year's interest to what is owed, then take off the payment.

Step-by-step solution

  1. 1
    12.5% is . Year 1: . After paying 8650, he owes .

    Why: Interest each year is on what is owed at the start of that year.

  2. 2
    Year 2: . After paying 9125, he owes .
  3. 3
    Year 3: .

    Why: The ₹10,000 still owed earns one more year of interest before the last payment.

Common mistakes

Option A

No year-by-year working gives ₹9,990.

Option B

Stops at what is owed at the start of year 3 and leaves out that year's interest.

Option C

No year-by-year working gives ₹10,590.

Skills used

Ideal time: about 1.5 min
70Logical Reasoning • Visual Reasoning
Easy

Consider the following figures :

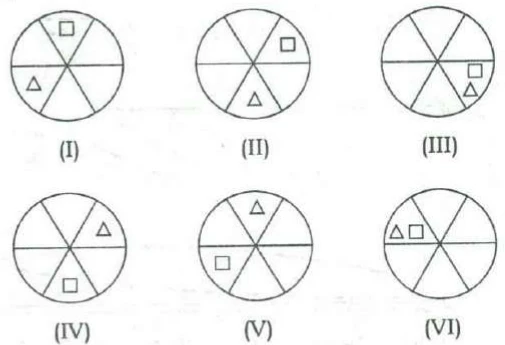
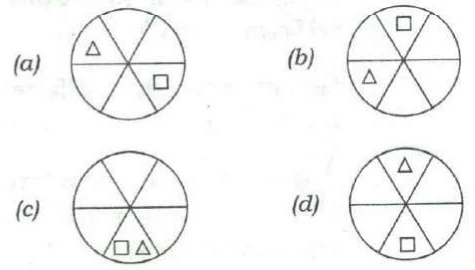
Six circles labelled (I) to (VI). Each circle is divided into six sectors by a horizontal diameter and two slanting diameters; name the sectors top, upper-right, lower-right, bottom, lower-left, upper-left. Each circle holds a small square and a small triangle. (I): square top, triangle lower-left. (II): square upper-right, triangle bottom. (III): square and triangle both lower-right. (IV): triangle upper-right, square bottom. (V): triangle top, square lower-left. (VI): triangle and square both upper-left, triangle to the left of the square.

In the figures (I) to (VI) above, some parts are shown to change their positions in regular directions. Following the same sequence, which of the figures given below will appear at (VII) stage?

Four answer circles labelled (a) to (d), divided into the same six sectors. (a): triangle upper-left, square lower-right. (b): square top, triangle lower-left. (c): square and triangle both bottom, square to the left of the triangle. (d): triangle top, square bottom.
Options
Show answer & solution

Option B

Figure (b)

Why

Name the six parts of the circle clockwise: top, upper-right, lower-right, bottom, lower-left, upper-left. The square moves one part clockwise each time: top, upper-right, lower-right, bottom, lower-left, upper-left. Next it returns to the top. The triangle moves one part anticlockwise each time: lower-left, bottom, lower-right, upper-right, top, upper-left. Next it goes to lower-left. So stage VII has the square at the top and the triangle in the lower-left part, the same as stage I.

Proof

Stage VII: square top, triangle lower-left. That is figure (b).

About the other options

Option A

The triangle stays in the upper-left and the square jumps three parts; neither moves one step from stage VI.

Option C

Both shapes at the bottom; neither is one step on from stage VI.

Option D

The triangle at the top and the square at the bottom; neither is one step on from stage VI.

Ideal time: about 50 s
71Quantitative Aptitude • Ratio and Proportion
Moderate

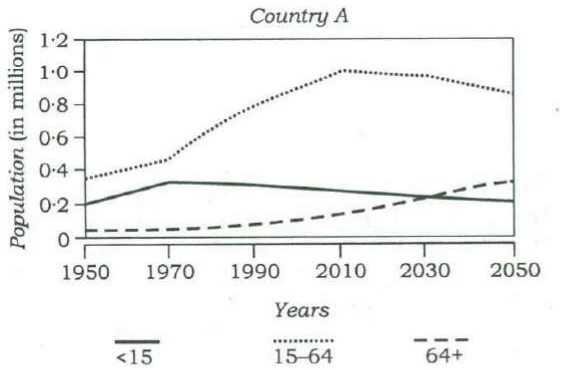
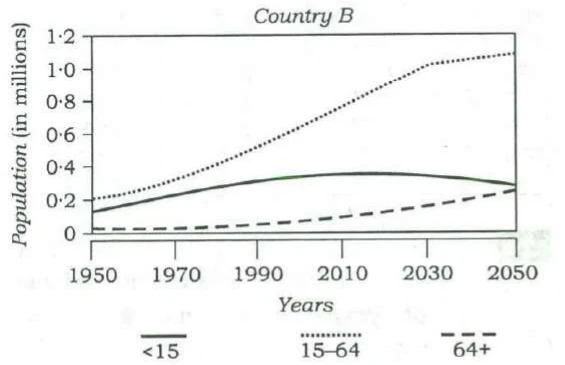
Consider the following graphs. The curves in the graphs indicate different age groups in the populations of two countries A and B over a period of few decades :

Country A: a line graph. Vertical axis: Population (in millions), marked 0 to 1.2 in steps of 0.2. Horizontal axis: Years, marked 1950, 1970, 1990, 2010, 2030, 2050. Legend: solid line <15, dotted line 15–64, dashed line 64+. Approximate values at 1950, 1970, 1990, 2010, 2030, 2050: 15–64 (dotted) 0.35, 0.47, 0.8, 1.0, 0.98, 0.87; <15 (solid) 0.2, 0.33, 0.31, 0.28, 0.24, 0.21; 64+ (dashed) 0.04, 0.05, 0.08, 0.15, 0.24, 0.34. The solid and dashed lines cross at about 2030.
Country B: a line graph with the same axes and legend. Approximate values at 1950, 1970, 1990, 2010, 2030, 2050: 15–64 (dotted) 0.2, 0.33, 0.53, 0.78, 1.03, 1.1; <15 (solid) 0.13, 0.23, 0.32, 0.36, 0.35, 0.29; 64+ (dashed) 0.03, 0.03, 0.05, 0.1, 0.17, 0.26.

With reference to the above graphs, which of the following are the most logical and rational inferences that can be made?

1
Over the last two and a half decades, the dependency ratio for country B has decreased.
2
By the end of next two and a half decades, the dependency ratio of country A will be much less than that of country B.
3
In the next two decades, the workforce relative to its total population will increase in country B as compared to country A.

Select the correct answer using the code given below.

Options
Show answer & solution

Option C

1 and 3 only

Why

Dependency ratio = (children under 15 + people over 64) (people aged 15 to 64). It shows how many people each worker-age person supports. Read the graphs in millions, counting from 2018, the year of the paper. 1: Right. Country , 1990: . 2010: . The ratio fell. 2: Wrong. Around 2040, : ; : . 's ratio is higher, because its over-64 group grows fast. 3: Right. Over the next twenty years 's 15 to 64 group keeps growing, and its share of the people rises from about 0.64 to 0.67. In that group shrinks while the over-64 group grows, and its share falls from about 0.69 to 0.65.

Proof

Dependency ratio of : in 1990, in 2010. Around 2040: , . Workforce share, 2018 to 2038: about to , about to .

About the other options

Option A

Statement 2 is wrong: A's dependency ratio will be higher than B's, not much lower.

Option B

Statement 2 is wrong, and statement 1 holds: B's dependency ratio fell from about 0.70 to 0.59.

Option D

Statement 2 is wrong: A's ageing population pushes its ratio above B's.

Ideal time: about 2 min
72Logical Reasoning • Puzzles and Distribution
Easy

Lakshmi, her brother, her daughter and her son are badminton players. A game of doubles is about to begin :

(i)
Lakshmi's brother is directly across the net from her daughter.
(ii)
Her son is diagonally across the net from the worst player's sibling.
(iii)
The best player and the worst player are on the same side of the net.

Who is the best player?

Options
Show answer & solution

Option A

Her brother

Why

Two pairs of siblings play: Lakshmi and her brother, and her daughter and her son. Clue (i) puts the brother and the daughter on opposite sides. So the sides are either brother + Lakshmi against daughter + son, or brother + son against daughter + Lakshmi. Case 1: brother + Lakshmi against daughter + son. The son is directly across from Lakshmi, so diagonally across from the brother. The worst player's sibling is the brother, so the worst player is Lakshmi. The best player is on her side: the brother. Case 2: brother + son against daughter + Lakshmi. The son is directly across from Lakshmi, so diagonally across from the daughter. The worst player's sibling is the daughter, so the worst player is the son. The best player is on his side: the brother. Both cases give the same best player.

Proof

Case 1: worst Lakshmi, best brother. Case 2: worst son, best brother.

About the other options

Option B

In both cases the daughter is on the side opposite the worst player.

Option C

The son is opposite the worst player in case 1, and is the worst player in case 2.

Option D

Lakshmi is the worst player in case 1 and opposite the worst player in case 2.

Ideal time: about 1.5 min
73Logical Reasoning • Critical Reasoning
Easy

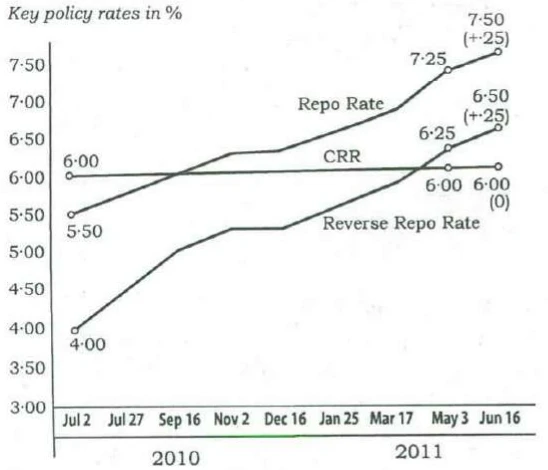
The graph given below indicates the changes in key policy rates made by the Central Bank several times in a year :

A line graph titled Key policy rates in %. Vertical axis marked 3.00 to 7.50 in steps of 0.50. Horizontal axis marked Jul 2, Jul 27, Sep 16, Nov 2, Dec 16 (under 2010), Jan 25, Mar 17, May 3, Jun 16 (under 2011). Three lines. Repo Rate rises from 5.50 (labelled) at Jul 2 through about 5.75, 6.00, 6.25, 6.25, 6.50, 6.75 to 7.25 (labelled) at May 3 and 7.50 (+.25) (labelled) at Jun 16. CRR is flat: 6.00 (labelled) at Jul 2, 6.00 (labelled) at May 3, and 6.00 (0) (labelled) at Jun 16. Reverse Repo Rate rises from 4.00 (labelled) at Jul 2 through about 4.50, 5.00, 5.25, 5.25, 5.50, 5.75 to 6.25 (labelled) at May 3 and 6.50 (+.25) (labelled) at Jun 16. Unlabelled values are read by eye.

Which one of the following can be the most likely reason for the Central Bank for such an action?

Options
Show answer & solution

Option D

Anti-inflationary stance

Why

From July 2010 to June 2011 the Central Bank raised the repo rate from 5.50% to 7.50% and the reverse repo rate from 4.00% to 6.50%, step after step, and kept the CRR at 6%. The repo rate is the interest the central bank charges banks for short loans. When it rises, borrowing costs more, people and firms borrow and spend less, and prices rise more slowly. Raising rates again and again like this is the usual way to fight inflation (a general rise in prices).

Proof

Repo rate 5.50% to 7.50% and reverse repo rate 4.00% to 6.50% in under a year: money is made dearer to slow price rises.

About the other options

Option A

Policy rates are not raised step by step to draw foreign investment; the target is prices at home.

Option B

Higher rates make borrowing dearer and take money out of circulation; they reduce liquidity (money available to lend), not increase it.

Option C

Higher rates may reward savers, but steady rate rises are a tool to control prices, and they do nothing for public saving.

Ideal time: about 40 s
74Logical Reasoning • Critical Reasoning
Easy

Directions for the following 2 (two) items :

The following table gives the GDP growth rate and Tele-density data of different States of a country in a particular year. Study the table and answer the two items that follow.

StatesPer capita income ()GDP growth rate (%)Tele-density
State 17049.5270.27
State 24195.3135.88
State 325410.8350.07
State 45459.785.94
State 589110.876.12
State 6107711.6977.5
State 79008.88104.86
State 83955.926
State 97207.7682.25
State 108939.5596.7
State 113634.757.7
State 129667.8563.8
State 134959.3752.3
State 148645.4697.9
State 154977.4862.3
State 167777.0393.8
State 173355.849.9
State 185997.4947.84

With reference to the above table, which of the following is/are the most logical and rational inference/inferences that can be made?

1
Higher per capita income is generally associated with higher Tele-density.
2
Higher GDP growth rate always ensures higher per capita income.
3
Higher GDP growth rate does not necessarily ensure higher Tele-density.

Select the correct answer using the code given below.

Options
Show answer & solution

Option C

1 and 3

Why

1: Right. The nine States with per capita income of $700 or more have an average tele-density of about 85; the nine below $700 average about 41. There are exceptions, such as State 4, so 'generally' fits. 2: Wrong. 'Always' fails: State 3 has one of the highest growth rates (10.83%) but the lowest per capita income ($254). 3: Right. State 4 grows at 9.78% but has a tele-density of only 5.94, while State 14 grows at 5.46% with a tele-density of 97.9.

Proof

State 3: growth 10.83%, income $254. State 4: growth 9.78%, tele-density 5.94. State 14: growth 5.46%, tele-density 97.9.

About the other options

Option A

Leaves out statement 3, which States 4 and 14 show.

Option B

Includes statement 2; State 3 has high growth and the lowest income.

Option D

Leaves out statement 1; richer States mostly have far higher tele-density.

Ideal time: about 1.5 min
75Logical Reasoning • Critical Reasoning
Easy

Same directions as Q74

With reference to the above table, the following assumptions have been made :

1
Nowadays, prosperity of an already high performing State cannot be sustained without making further large investments in its telecom infrastructure.
2
Nowadays, a very high Tele-density is the most essential condition for promoting the business and economic growth in a State.

Which of the above assumptions is/are valid?

Options
Show answer & solution

Option D

Neither 1 nor 2

Why

The table gives one year's figures. It says nothing about investment, about keeping prosperity going over time, or about what is 'most essential'. 1: Not valid. There are no figures on investment and none on how prosperity changes over time. 2: Not valid. 'Most essential condition' is far too strong, and the table goes against it: State 6 has the highest growth (11.69%) with a tele-density of 77.5, while State 7 has the highest tele-density (104.86) with growth of only 8.88%.

Proof

State 6: growth 11.69%, tele-density 77.5. State 7: tele-density 104.86, growth 8.88%.

About the other options

Option A

The table has no data on investment or on sustaining prosperity.

Option B

'Most essential' is not shown; the fastest-growing State does not have the highest tele-density.

Option C

Neither assumption rests on the table.

Ideal time: about 50 s
76Quantitative Aptitude • Percentages
Easy

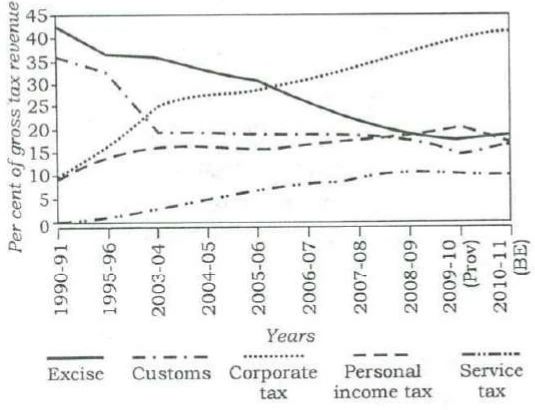
The following graph indicates the composition of our tax revenue for a period of two decades :

A line graph. Vertical axis: Per cent of gross tax revenue, 0 to 45 in steps of 5. Horizontal axis: Years, 1990-91, 1995-96, 2003-04, 2004-05, 2005-06, 2006-07, 2007-08, 2008-09, 2009-10 (Prov), 2010-11 (BE). Five lines, with approximate values at those years in order: Excise (solid) 42.5, 36.5, 36, 33, 31, 26, 22, 19.5, 18, 19.5; Customs (dash-dot) 36, 33, 19.5, 19.5, 19, 19, 19, 18, 15, 17.5; Corporate tax (dotted) 9.5, 16, 25, 28, 29, 32, 35, 37.5, 40, 42; Personal income tax (dashed) 9.5, 14, 16, 16.5, 16, 17, 18, 19, 21, 18; Service tax (dash-dot-dot) 0, 1, 3, 5, 7, 8.5, 9.5, 11, 11, 10.8. Values are read by eye.

With reference to the above graph, which of the following is/are the most logical and rational inference/inferences that can be made?

1
During the given period, the revenue from Direct Taxes as percentage of gross tax revenue has increased while that of Indirect Taxes decreased.
2
The trend in the revenue from Excise Duty demonstrates that the growth of manufacturing sector has been negative during the given period.

Select the correct answer using the code given below.

Options
Show answer & solution

Option A

1 only

Why

Direct taxes are taxes on income: corporate tax and personal income tax. Indirect taxes are taxes on goods and services: excise, customs and service tax. 1: Right. Direct taxes rose from about 9.5 + 9.5 = 19% of gross tax revenue in 1990-91 to about 42 + 18 = 60% in 2010-11. Indirect taxes fell from about 42.5 + 36 + 0 = 78.5% to about 19.5 + 17.5 + 11 = 48%. 2: Wrong. The graph shows excise as a share of all tax revenue. A falling share can come from other taxes growing faster, or from lower excise rates. It does not show that manufacturing shrank.

Proof

Direct taxes: about 19% to 60%. Indirect taxes: about 78.5% to 48%.

About the other options

Option B

Excise's share fell, but a share of the total says nothing about whether manufacturing grew.

Option C

Statement 2 does not follow from a share of revenue.

Option D

Statement 1 holds: the direct taxes' share tripled while the indirect taxes' share fell.

Ideal time: about 1.5 min
77Quantitative Aptitude • Inequalities
Easy

If , then which of the following must be true?

1
Both and must be positive for any value of and .
2
If is positive, must be negative for any value of and .
3
If is negative, must be positive for any value of and .

Select the correct answer using the code given below.

Options
Show answer & solution

Option D

Neither 1 nor 2 nor 3

Approach

A 'must be true' claim fails as soon as one pair with breaks it, so look for such a pair.

Step-by-step solution

  1. 1
    Statement 1: , gives , but is negative. False.

    Why: 'Must' means for every pair; one pair that breaks it is enough.

  2. 2
    Statement 2: , gives ; is positive and so is . False.
  3. 3
    Statement 3: . If is negative, is even more negative, so is negative. False.

    Why: is always 8 less than , so a negative can never give a positive .

Common mistakes

Option A

Tries only pairs like , and misses that can be negative.

Option B

Tries only pairs like , and misses that is positive whenever .

Option C

Each of statements 1 and 2 fails for some pair, so neither must hold.

Skills used

Ideal time: about 45 s
78Reading Comprehension • Crux and Conclusion
Moderate

Directions for the following 3 (three) items :

Read the following two passages and answer the items that follow. Your answers to these items should be based on the passages only.

Passage—1

The quest for cheap and plentiful meat has resulted in factory farms where more and more animals are squeezed into smaller lots in cruel and shocking conditions. Such practices have resulted in many of the world's health pandemics such as the avian flu. Worldwide, livestock are increasingly raised in cruel, cramped conditions, where animals spend their short lives under artificial light, pumped full of antibiotics and growth hormones, until the day they are slaughtered. Meat production is water-intensive. 15000 litres of water is needed for every kilogram of meat compared with 3400 litres for rice, 3300 litres for eggs and 255 litres for a kilogram of potatoes.

What is the most rational and crucial message given by the passage?

Options
Show answer & solution

Option D

Environmental cost of meat production is unsustainable when it is produced through industrial farming.

Why

The passage says the search for cheap meat has led to factory farms, which are cruel, spread pandemics and use huge amounts of water. Among the options, D gives the cost the passage proves with numbers. The other options either go beyond the passage or reverse it.

Proof

The quest for cheap and plentiful meat has resulted in factory farms … Meat production is water-intensive. 15000 litres of water is needed for every kilogram of meat compared with 3400 litres for rice

About the other options

Option A

Reverses the passage: it shows factory farming as harmful, not as a good source of protein.

Option B

Not in the passage: it calls the conditions cruel but never mentions any law.

Option C

Too strong: the passage shows the harm, but it never says the practice should be stopped immediately.

Ideal time: about 1.5 min
79Reading Comprehension • Crux and Conclusion
Easy

Directions for the following 3 (three) items :

Read the following two passages and answer the items that follow. Your answers to these items should be based on the passages only.

Passage—2

A male tiger was removed from Pench Tiger Reserve and was relocated in Panna National Park. Later, this tiger trekked toward his home 250 miles away. The trek of this solitary tiger highlights a crisis. Many wildlife reserves exist as islands of fragile habitat in a vast sea of humanity, yet tigers can range over a hundred miles, seeking prey, mates and territory. Nearly a third of India's tigers live outside tiger reserves, a situation that is dangerous for both human and animal. Prey and tigers can only disperse if there are recognized corridors of land between protected areas to allow unmolested passage.

Which of the following is the most rational and crucial message given by the passage?

Options
Show answer & solution

Option B

Safe wildlife corridors between protected areas is an essential aspect of conservation efforts.

Why

The passage uses one tiger's long walk home to show that reserves are islands in a sea of people, while tigers range widely. It ends by saying tigers and prey can move only if there are corridors between protected areas. So safe corridors are essential to conservation.

Proof

Many wildlife reserves exist as islands of fragile habitat in a vast sea of humanity … Prey and tigers can only disperse if there are recognized corridors of land between protected areas to allow unmolested passage

About the other options

Option A

Reverses the passage: it names a way forward, which is corridors.

Option C

Not in the passage: the problem is the gaps between reserves, not the number of reserves.

Option D

Not in the passage: it says nothing about how parks are managed.

Ideal time: about 50 s
80Reading Comprehension • Assumption
Moderate

Same directions as Q79

With reference to the above passage, the following assumptions have been made :

1
The strategy of conservation of wildlife by relocating them from one protected area to another is not often successful.
2
India does not have suitable legislation to save the tigers, and its conservation efforts have failed which forced the tigers to live outside protected areas.

Which of the above assumptions is/are valid?

Options
Show answer & solution

Option A

1 only

Why

The passage tells of a tiger moved from Pench to Panna that walked back towards its home 250 miles away, and calls this a crisis. 1 valid: the passage offers the relocated tiger's trek home as its example of the problem. It takes for granted that relocating animals between protected areas does not work well. 2 not valid: the passage says nothing about laws, and says tigers live outside reserves because they range far, not because conservation has failed.

Proof

A male tiger was removed from Pench Tiger Reserve and was relocated in Panna National Park. Later, this tiger trekked toward his home 250 miles away. The trek of this solitary tiger highlights a crisis.

About the other options

Option B

Includes 2, which is not in the passage: it never mentions laws or failed conservation, and leaves out 1.

Option C

Includes 2, which is not in the passage.

Option D

Drops 1, though the passage opens with a failed relocation as its example of the crisis.

Ideal time: about 1 min