Skip to content

Elementary Mathematics 2025 (I)

Set A

Questions 81–100 of 100

81Algebra • Polynomial • Factor and Remainder Theorem
Moderate

If is a factor of , then what are the values of and respectively?

Options
Show answer & solution

Option A

Approach

factorises as . Both and must make zero.

Step-by-step solution

  1. 1

    Why: Split the middle term: .

  2. 2

    Why: Factor theorem: if is a factor then the value at is zero.

  3. 3

    Why: The same for .

  4. 4

    Why: Subtract the first equation from the second to remove .

Common mistakes

Option B

Gives the values in the wrong order: then .

Option C

No clear route to .

Option D

No clear route to .

Skills used

Ideal time: about 1.5 min
82Algebra • Quadratic Equations • Roots
Easy

If two quadratic equations and have a common root , then what is equal to?

Options
Show answer & solution

Option B

Approach

A common root satisfies both equations. Put in each one to find and .

Step-by-step solution

  1. 1

    Why: is a root of the first equation, so it makes it zero.

  2. 2

    Why: is also a root of the second equation.

  3. 3

    Why: Add the two values.

Common mistakes

Option A

No clear route to .

Option C

No clear route to .

Option D

No clear route to .

Skills used

Ideal time: about 1 min
83Algebra • Polynomial • HCF and LCM
Moderate

What is the HCF of the polynomials and ?

Options
Show answer & solution

Option C

Approach

Factor the first polynomial completely. Then take the common factors with the lowest power.

Step-by-step solution

  1. 1

    Why: Add and subtract to make a perfect square minus a square.

  2. 2

    Why: Use with and . Here , so .

  3. 3

    Why: The second polynomial is one of the two factors found. It divides the first exactly.

  4. 4

    Why: The HCF of a polynomial and one of its own factors is that factor.

Common mistakes

Option A

Does not factorise the first polynomial, and so thinks the two polynomials have no common factor.

Option B

Picks the other factor of , which is not a factor of .

Option D

No clear route to .

Skills used

Ideal time: about 1.5 min
84Mensuration • Plane Figures • Circle
Very easy

An arc AB of a circle subtends an angle radian at the centre O. If the area of the sector AOB is equal to half of the square of length of arc AB, then what is equal to?

Options
Show answer & solution

Option C

Approach

Write the sector area and the arc length using the angle in radians. Put them in the given condition.

Step-by-step solution

  1. 1

    Why: With the angle in radians, arc length is and sector area is .

  2. 2

    Why: The area equals half of the square of the arc length.

  3. 3

    Why: Divide by , which is not zero. Also since there is an arc.

Common mistakes

Option A

No clear route to .

Option B

Leaves out the word 'half' and reads the condition as area (arc length), giving and .

Option D

No clear route to .

Skills used

Ideal time: about 40 s
85Arithmetic • Number System • LCM and HCF
Easy

Consider the following statements in respect of prime numbers and :

I
Their LCM is always an odd number.
II
Sum of their LCM and HCF is always an even number.

Which of the statements given above is/are correct?

Options
Show answer & solution

Option D

Neither I nor II

Approach

Test each statement with a case that includes the prime , since it is the only even prime.

Step-by-step solution

  1. 1

    Why: Statement I says the LCM is always odd. The LCM of and is even, so I is false.

  2. 2

    Why: Statement II says the sum is always even. is odd, so II is false.

Common mistakes

Option A

Finds that II fails with and but does not test in statement I, and so keeps I.

Option B

Sees that breaks I but checks II only with odd primes, where the sum is even.

Option C

Uses only odd primes for both statements, where the LCM is odd and the sum is even.

Skills used

Ideal time: about 1 min
86Statistics • Frequency Distribution
Very easy

Consider the following for the next five (05) items that follow :

The frequency distribution of observations on X is given below :

X3567
Frequency

What is the value of ?

Options
Show answer & solution

Option A

Approach

The frequencies add up to the number of observations, . Write that as an equation in .

Step-by-step solution

  1. 1

    Why: The total of all the frequencies is the number of observations.

  2. 2

    Why: Collect like terms and solve.

Common mistakes

Option B

No clear route to .

Option C

No clear route to .

Option D

No clear route to .

Skills used

Ideal time: about 35 s
87Statistics • Median
Easy

Same directions as Q86

What is the median of the frequency distribution?

Options
Show answer & solution

Option C

Approach

Use from the total. List the frequencies as running totals and find which value holds the middle observation.

Step-by-step solution

  1. 1

    Why: From , the frequencies of are .

  2. 2

    Why: Add the frequencies one by one.

  3. 3

    Why: is odd, so the median is the rd value.

  4. 4

    Why: The first values are or . The rd is the first .

Common mistakes

Option A

No clear route to .

Option B

The cumulative frequency at is , which is next to . Stops at because looks like , which is off by one.

Option D

The variable takes only the values , so the median can be found. No clear route.

Skills used

Ideal time: about 1 min
88Statistics • Mode
Very easy

Same directions as Q86

What is the mode of the frequency distribution?

Options
Show answer & solution

Option C

Approach

The mode is the value with the highest frequency. Find the frequencies and compare.

Step-by-step solution

  1. 1

    Why: With , the frequencies are , , , .

  2. 2

    Why: The mode is the value , not the frequency .

Common mistakes

Option A

No clear route to .

Option B

Gives the median from the previous item instead of the mode.

Option D

The variable has separate values, so the highest frequency is clear. No clear route.

Skills used

Ideal time: about 30 s
89Statistics • Data Classification
Easy

Same directions as Q86

What is the most appropriate graphical representation of the given frequency distribution of X?

Options
Show answer & solution

Option A

Bar diagram

Approach

Decide whether takes separate values or any value in an interval, and pick the chart for that kind of data.

Step-by-step solution

  1. 1

    Why: The table lists four separate values with no classes. So the data is discrete.

  2. 2

    Why: A bar diagram shows separate bars with gaps for separate values. A histogram and a frequency polygon need a continuous scale of classes.

Common mistakes

Option B

A histogram is for continuous data in class intervals. Here takes isolated values.

Option C

A frequency polygon joins the class midpoints of continuous data. Joining separate values with a line is not appropriate.

Option D

A pie chart shows parts of a whole, and four values with observations is a poor fit.

Skills used

Ideal time: about 45 s
90Statistics • Mean
Easy

Same directions as Q86

What is the mean of the frequency distribution?

Options
Show answer & solution

Option C

Approach

Use the weighted mean: sum of (value frequency) divided by the total frequency.

Step-by-step solution

  1. 1

    Why: Multiply each value by its frequency and add.

  2. 2

    Why: Divide by the total frequency , not by .

Common mistakes

Option A

No clear route to .

Option B

No clear route to .

Option D

No clear route to .

Skills used

Ideal time: about 1.5 min
91Statistics • Frequency Distribution
Very easy

Consider the following for the next two (02) items that follow :

The frequency distribution of marks obtained by students in an English examination is given below :

Marks obtainedNumber of Students
Below 4050
Below 50125
Below 60210
Below 70315
Below 80350

What is the number of students who scored between and marks?

Options
Show answer & solution

Option A

Approach

The table gives 'below' totals (cumulative frequencies). The number in a class is the difference of two neighbouring totals.

Step-by-step solution

  1. 1

    Why: Students below minus students below are exactly those with marks from up to .

Common mistakes

Option B

No clear route to .

Option C

No clear route to .

Option D

Reads the 'Below ' row, , as the class to .

Skills used

Ideal time: about 35 s
92Statistics • Frequency Distribution
Very easy

Same directions as Q91

What is the number of students who scored more than marks?

Options
Show answer & solution

Option D

Approach

Marks of more than are everyone except those below . The last row gives the total.

Step-by-step solution

  1. 1

    Why: The last 'Below ' row is the total, as no student is shown above . Students below are . The rest scored or more.

Common mistakes

Option A

No clear route to .

Option B

Gives the number below , which is , not the number above.

Option C

No clear route to .

Skills used

Ideal time: about 35 s
93Statistics • Data Interpretation • Table
Easy

Consider the following for the next three (03) items that follow :

Circulation figures (in thousands) of different newspapers (A, B, C, D, E) for five years are given below :

YearABCDE
2019201015820
20201212181212
20212414171415
2022261016159
20232216141611

In which of the given years was the circulation of the newspaper D close to its average circulation over all the years?

Options
Show answer & solution

Option A

and

Approach

Find the average circulation of newspaper D over the five years. Then see which years are closest to it.

Step-by-step solution

  1. 1

    Why: Add the five values in column D and divide by .

  2. 2

    Why: has and has . Both are away. The other years are , and away.

Common mistakes

Option B

No clear route to and . Both are farther from than and

Option C

The value in is away from , but two years are only away.

Option D

Finds that is away from the average and stops, missing that is also away.

Skills used

Ideal time: about 1 min
94Statistics • Data Interpretation • Table
Easy

Same directions as Q93

In which of the years from to was the circulation of the newspaper D close to the average circulation of all the newspapers in that year?

Options
Show answer & solution

Option D

Approach

For each year from to , find the average of the five newspapers. Then compare the circulation of D with that average.

Step-by-step solution

  1. 1

    Why: Add the row and divide by .

  2. 2

    Why: Same method.

  3. 3

    Why: Same method.

  4. 4

    Why: The smallest gap is in .

Common mistakes

Option A

No clear route to ; the gap there is the largest.

Option B

In four of the five newspapers have the same circulation , and D is one of them. That makes look like the average, but the average is and the gap is .

Option C

No clear route to .

Skills used

Ideal time: about 1.5 min
95Statistics • Data Interpretation • Table
Moderate

Same directions as Q93

How many cases are there in which average of the circulation for an individual newspaper was more than the average of the circulation of all the newspapers?

Options
Show answer & solution

Option B

Two

Approach

Find the average of each newspaper over the five years. Then find the average of all the newspapers and count how many are above it.

Step-by-step solution

  1. 1

    Why: Add each column and divide by .

  2. 2

    Why: Add all column totals and divide by the entries. This is the same as the mean of the five averages.

  3. 3

    Why: Only A and C are above . B, D and E are below it.

Common mistakes

Option A

Counts only A, which is clearly above, and misses C at .

Option C

Uses a rough average near , which wrongly puts E at above it as well.

Option D

No clear route to four.

Skills used

Ideal time: about 1.5 min
96Statistics • Data Interpretation • Pie Chart
Moderate

Consider the following for the next three (03) items that follow :

Study the following Pie Charts :

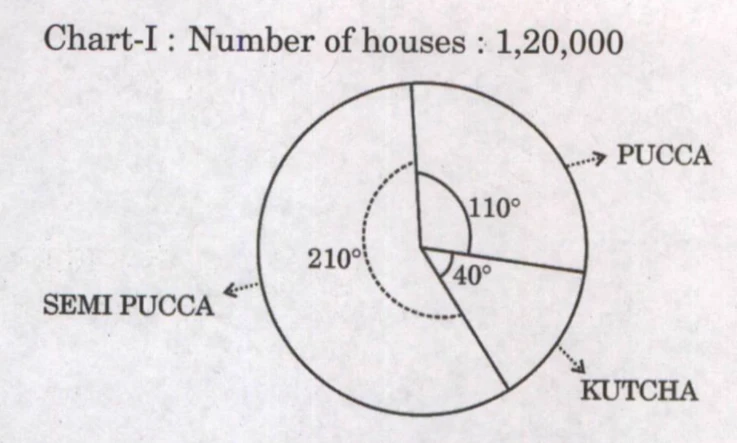
Chart-I : Number of houses :

Pie chart titled "Chart-I : Number of houses : 1,20,000" divided into three sectors: PUCCA with central angle 110°, KUTCHA with central angle 40°, and SEMI PUCCA with central angle 210°. The three angles sum to 360°. Labels PUCCA, KUTCHA and SEMI PUCCA are placed outside the circle with arrows pointing to their sectors.

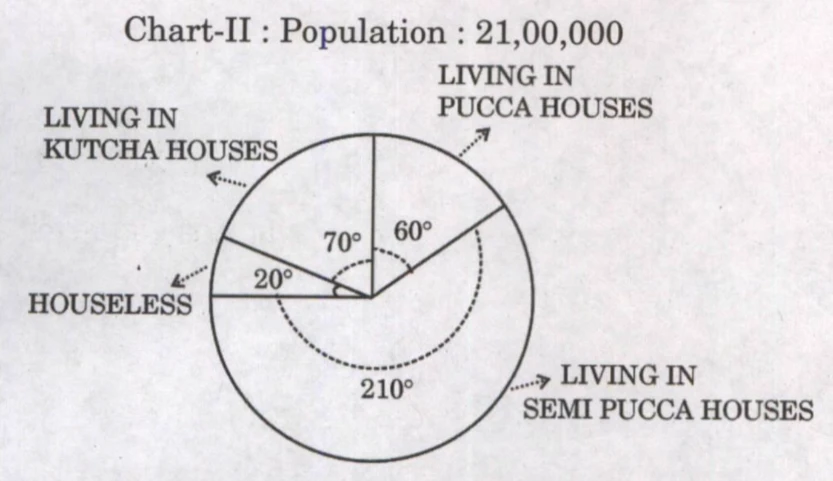
Chart-II : Population :

Pie chart titled "Chart-II : Population : 21,00,000" divided into four sectors: LIVING IN PUCCA HOUSES with central angle 60°, LIVING IN KUTCHA HOUSES with central angle 70°, HOUSELESS with central angle 20°, and LIVING IN SEMI PUCCA HOUSES with central angle 210°. The four angles sum to 360°. Labels are placed outside the circle with arrows pointing to their sectors.

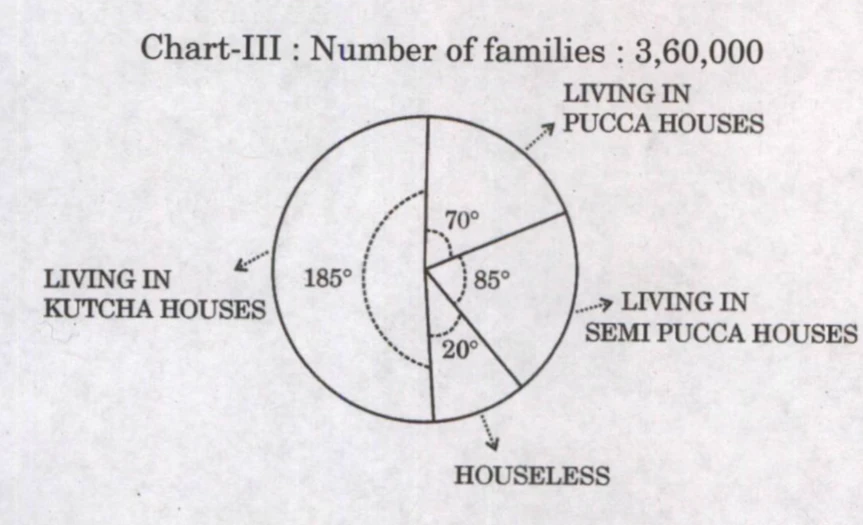
Chart-III : Number of families :

Pie chart titled "Chart-III : Number of families : 3,60,000" divided into four sectors: LIVING IN PUCCA HOUSES with central angle 70°, LIVING IN SEMI PUCCA HOUSES with central angle 85°, HOUSELESS with central angle 20°, and LIVING IN KUTCHA HOUSES with central angle 185°. The four angles sum to 360°. Labels are placed outside the circle with arrows pointing to their sectors.

On an average, how many persons live in every pucca house?

Options
Show answer & solution

Option C

Approach

In a pie chart, a sector holds its angle's share of the whole. Find the number of persons in pucca houses from Chart-II and the number of pucca houses from Chart-I. Then divide.

Step-by-step solution

  1. 1

    Why: Chart-II: the sector for 'living in pucca houses' is of of the population.

  2. 2

    Why: Chart-I: the pucca sector is of the houses.

  3. 3

    Why: Divide persons by houses.

Common mistakes

Option A

No clear route to .

Option B

No clear route to .

Option D

No clear route to .

Skills used

Ideal time: about 1.5 min
97Statistics • Data Interpretation • Pie Chart
Moderate

Same directions as Q96

If more Kutcha houses are built, then what will be approximate change in angle for Kutcha houses in Pie Chart-I?

Options
Show answer & solution

Option B

Approach

Find the Kutcha angle now, then the Kutcha angle after more houses are added to the total. The change is the difference.

Step-by-step solution

  1. 1

    Why: Chart-I shows the Kutcha sector as .

  2. 2

    Why: Building more houses raises both the Kutcha count and the total.

  3. 3

    Why: Angle is the share of the new total times .

  4. 4

    Why: The change is the difference of the angles.

Common mistakes

Option A

No clear route to .

Option C

Takes only the extra as a share of the old total, , and forgets that the total also grows.

Option D

No clear route to .

Skills used

Ideal time: about 2 min
98Statistics • Data Interpretation • Pie Chart
Moderate

Same directions as Q96

If families from the “Houseless” category shift into Kutcha houses, what will be the average number of families in every Kutcha house?

Options
Show answer & solution

Option B

Approach

Find the number of families in Kutcha houses and the number of Kutcha houses. The shift of families changes only the families.

Step-by-step solution

  1. 1

    Why: Chart-III: the Kutcha sector is of the families.

  2. 2

    Why: houseless families move into Kutcha houses.

  3. 3

    Why: Chart-I: the Kutcha sector is . Families moving does not change the number of houses.

  4. 4

    Why: Divide families by houses.

Common mistakes

Option A

No clear route to .

Option C

No clear route to .

Option D

No clear route to .

Skills used

Ideal time: about 1.5 min
99Statistics • Data Classification
Moderate

Marks obtained by students in a test (Maximum Marks-100) are given below :

What is the percentage (approximate) of students getting marks higher than or equal to but less than ?

Options
Show answer & solution

Option B

Approach

Count the marks that are or more and less than , then divide by and multiply by .

Step-by-step solution

  1. 1

    Why: Pick the values with . Here and are left out because is not less than .

  2. 2

    Why: Same rule for the next two rows.

  3. 3

    Why: Same rule for the last two rows. The total is .

  4. 4

    Why: The base is all students.

Common mistakes

Option A

Counts values instead of , missing one, and .

Option C

Counts values by including the mark , which is not less than . .

Option D

No clear route to ; it needs values.

Skills used

Ideal time: about 2 min
100Statistics • Mean • Correcting Wrong Observations
Easy

The arithmetic mean of observations was . Later on, it was found that two observations were misread as and instead of and . What is the value of the corrected mean?

Options
Show answer & solution

Option B

Approach

Total from the mean, correct the total for the two misreads, then divide by again.

Step-by-step solution

  1. 1

    Why: Total mean number of observations.

  2. 2

    Why: Take away the two wrong values and add the right ones.

  3. 3

    Why: Divide by observations.

Common mistakes

Option A

No clear route to .

Option C

No clear route to .

Option D

No clear route to .

Skills used

Ideal time: about 1 min