Skip to content

Elementary Mathematics 2021 (II)

Set A

Questions 81–100 of 100

81Geometry • Circle • Tangents
Easy

Consider the following for the next three (03) items that follow :

is a triangle with sides cm, cm and cm. With vertices , and as centres, three circles are drawn each touching the other two externally.

What is the sum of the radii of the circles ?

Options
Show answer & solution

Option C

cm

Approach

Circles that touch externally have centres at a distance equal to the sum of their radii, so each side of the triangle gives one equation.

Step-by-step solution

  1. 1

    Why: Each side joins two centres and equals the sum of the two radii.

  2. 2

    Why: Add the three equations. Every radius appears twice.

  3. 3

    Why: Halve both sides.

Common mistakes

Option A

No common slip leads to this value; it sits on no natural wrong path.

Option B

No common slip leads to this value; it sits on no natural wrong path.

Option D

No common slip leads to this value; it sits on no natural wrong path.

Skills used
Ideal time: about 45 s
82Geometry • Triangle • Pythagoras Theorem
Easy

Same directions as Q81

What is the length of the altitude of the triangle drawn from vertex on ?

Options
Show answer & solution

Option D

cm

Approach

First check whether the triangle is right-angled; if so its area is easy and the altitude follows from the area.

Step-by-step solution

  1. 1

    Why: , so by the converse of Pythagoras' theorem the angle at is .

  2. 2

    Why: The two legs are perpendicular, so one can serve as the height for the other.

  3. 3

    Why: The same area is also half of times the altitude from .

Common mistakes

Option A

Wrote , forgetting the factor on the right side, and got .

Option B

No common slip leads to this value; it sits on no natural wrong path.

Option C

No common slip leads to this value; it sits on no natural wrong path.

Skills used

Ideal time: about 1 min
83Mensuration • Plane Figures • Circle
Hard

Same directions as Q81

If , and are the areas of sectors at , and within the triangle respectively, then which of the following is/are correct ?

1
cm
2
cm

Select the correct answer using the code given below :

Options
Show answer & solution

Option C

Both and

Approach

Find the three radii from the touching circles, then use the angle sum of the triangle to check both statements.

Step-by-step solution

  1. 1

    Why: The sum of the radii is from the previous item. Each radius is minus the side opposite its centre.

  2. 2

    Why: By the converse of Pythagoras' theorem the angle at is a right angle.

  3. 3

    Why: Statement 1: the sector at has angle and radius . This is true.

  4. 4

    Why: The angles of a triangle add to and .

  5. 5

    Why: Statement 2: has radius and has radius . Both coefficients become , so only the sum of the angles is needed.

Common mistakes

Option A

Verified statement 1 but did not finish statement 2, or used the wrong radii for and , and rejected it.

Option B

Verified statement 2 but found statement 1 false by using a wrong radius at (not cm).

Option D

Used the full circle or the wrong radii for the sectors and rejected both statements.

Skills used

Ideal time: about 2.5 min
84Geometry • Triangle • Pythagoras Theorem
Moderate

Consider the following for the next two (02) items that follow :

is triangle in which and is any point on .

Which one of the following is correct ?

Options
Show answer & solution

Option B

Approach

Drop the perpendicular from to and use Pythagoras twice; the difference of the two squares gives a product of segments.

Step-by-step solution

  1. 1

    Why: In an isosceles triangle with , the perpendicular from the apex meets the base at its midpoint.

  2. 2

    Why: Apply Pythagoras in the right triangles and . The terms cancel.

  3. 3

    Why: Factorise the difference of two squares. With between and , and .

  4. 4

    Why: Because , the same product also equals .

Common mistakes

Option A

Wrote in place of . The two sides of the product are the two parts of the base, not .

Option C

Wrote ; there is no factor and is not part of the product.

Option D

Put a factor on . The difference of squares gives the product with no extra factor.

Skills used

Ideal time: about 2 min
85Geometry • Triangle • Pythagoras Theorem
Easy

Same directions as Q84

If cm, cm and cm, then what is equal to ?

Options
Show answer & solution

Option A

cm

Approach

Use the relation from the previous item, , and then the fact .

Step-by-step solution

  1. 1

    Why: The relation holds for the isosceles triangle.

  2. 2

    Why: The triangle is isosceles with .

Common mistakes

Option B

Treated as perpendicular to and got , nearest to this option. Nothing says .

Option C

No common slip leads to this value; it sits on no natural wrong path.

Option D

No common slip leads to this value; it sits on no natural wrong path.

Skills used
Ideal time: about 1 min
86Geometry • Triangle • Pythagoras Theorem
Easy

Consider the following for the next three (03) items that follow :

is a triangle with cm, cm and cm. Let and be the mid-points of and respectively.

What is equal to ?

Options
Show answer & solution

Option B

cm

Approach

Check whether the triangle has a right angle; then is just .

Step-by-step solution

  1. 1

    Why: The sides satisfy Pythagoras' theorem, so .

  2. 2

    Why: is the mid-point of , so .

  3. 3

    Why: This equals .

Common mistakes

Option A

Calculated as instead of , giving .

Option C

No common slip leads to this value; it sits on no natural wrong path.

Option D

No common slip leads to this value; it sits on no natural wrong path.

Skills used
Ideal time: about 1 min
87Geometry • Triangle • Pythagoras Theorem
Moderate

Same directions as Q86

What is equal to ?

Options
Show answer & solution

Option C

Approach

Write each median length as a hypotenuse of a right triangle at , add them, and collect the squares.

Step-by-step solution

  1. 1

    Why: and is the mid-point of .

  2. 2

    Why: Same, with the mid-point of .

  3. 3

    Why: Add and collect; then by Pythagoras' theorem.

Common mistakes

Option A

Left out the extra terms and and added only .

Option B

No common slip leads to this value; it sits on no natural wrong path.

Option D

No common slip leads to this value; it sits on no natural wrong path.

Skills used

Ideal time: about 1.5 min
88Geometry • Triangle • Pythagoras Theorem
Moderate

Same directions as Q86

What is equal to ?

Options
Show answer & solution

Option B

cm

Approach

Use the same two right triangles, but subtract instead of adding.

Step-by-step solution

  1. 1

    Why: Pythagoras at the right angle , with and mid-points.

  2. 2

    Why: Subtract and multiply by .

  3. 3

    Why: Substitute and .

Common mistakes

Option A

No common slip leads to this value; it sits on no natural wrong path.

Option C

No common slip leads to this value; it sits on no natural wrong path.

Option D

No common slip leads to this value; it sits on no natural wrong path.

Skills used

Ideal time: about 1.5 min
89Geometry • Circle • Arcs and Angles
Very easy

Consider the following for the next two (02) items that follow :

is a diameter of a circle with centre . Radius is perpendicular to . Let be any point on arc .

What is equal to ?

Options
Show answer & solution

Option C

Approach

The triangle has two equal radii and a right angle at .

Step-by-step solution

  1. 1

    Why: Both are radii, and .

  2. 2

    Why: Base angles of an isosceles triangle are equal.

  3. 3

    Why: lies on , so . The angle sum of a triangle is .

Common mistakes

Option A

Assumed is a -- triangle; nothing in the question says so.

Option B

No common slip leads to this value; it sits on no natural wrong path.

Option D

Assumed is a -- triangle and took the other acute angle.

Skills used

Ideal time: about 45 s
90Geometry • Circle • Arcs and Angles
Easy

Same directions as Q89

What is equal to ?

Options
Show answer & solution

Option C

Approach

The angle at the circumference on arc is half the angle at the centre on the same arc.

Step-by-step solution

  1. 1

    Why: and passes through .

  2. 2

    Why: lies on arc , which is away from the arc . The arc subtends at the centre, so it subtends half of that at .

Common mistakes

Option A

No common slip leads to this value; it sits on no natural wrong path.

Option B

No common slip leads to this value; it sits on no natural wrong path.

Option D

No common slip leads to this value; it sits on no natural wrong path.

Skills used

Ideal time: about 45 s
91Statistics • Data Interpretation • Pie Chart
Moderate

Consider the following for the next four (04) items that follow :

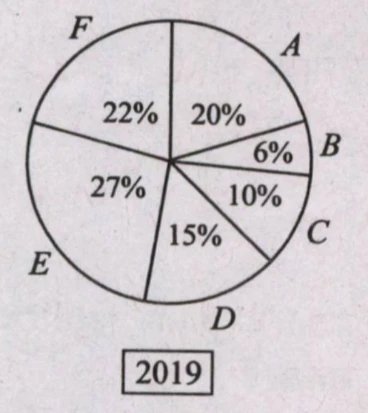
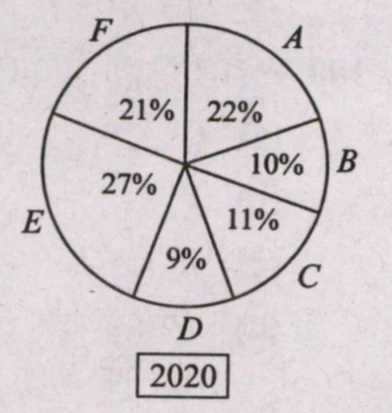
The following Pie-Charts show the percentage of different categories (, , , , and ) of employees in a company in the year and . The total number of employees was in and in .

Pie chart labelled 2019 in a box beneath it, divided into six sectors read clockwise from the top: A 20%, B 6%, C 10%, D 15%, E 27%, F 22%. Each sector carries its percentage inside and its category letter outside the circle. The six percentages sum to 100.
Pie chart labelled 2020 in a box beneath it, divided into six sectors read clockwise from the top: A 22%, B 10%, C 11%, D 9%, E 27%, F 21%. Each sector carries its percentage inside and its category letter outside the circle. The six percentages sum to 100.

There are two categories of employees in whose total strength remained the same in . What are these two categories ?

Options
Show answer & solution

Option D

and

Approach

Turn each percentage into a head count using the total for that year, then compare counts category by category.

Step-by-step solution

  1. 1

    Why: Percentages in a pie chart are shares of that year's total.

  2. 2

    Why: The 2020 total is , not .

  3. 3

    Why: The question asks about the total of two categories, so add their counts for each year.

  4. 4

    Why: The pairs in the other options give , and .

Common mistakes

Option A

No common slip leads to this value; it sits on no natural wrong path.

Option B

Compared percentage shares instead of counts. is in 2019 and in 2020, which are close, but the totals and differ.

Option C

Compared percentage shares instead of counts. is in 2019 and in 2020, which are close, but the totals and differ.

Skills used

Ideal time: about 2 min
92Statistics • Data Interpretation • Pie Chart
Moderate

Same directions as Q91

In which one of the following categories of employees, the percentage change in number of employees in was maximum as compared to ?

Options
Show answer & solution

Option B

Approach

Convert each category to a head count in both years, and compare the percentage change, not the size of the change.

Step-by-step solution

  1. 1

    Why: Each count is the percentage times the year's total ( or ).

  2. 2

    Why: Percentage change is .

  3. 3

    Why: more than doubles, so no other category can match it.

Common mistakes

Option A

Chose the category with the largest increase in number of employees (), not the largest percentage change.

Option C

No common slip leads to this value; it sits on no natural wrong path.

Option D

Chose the category whose share fell the most, to . Comparing percentage points of share is not percentage change in employees.

Skills used

Ideal time: about 1.5 min
93Statistics • Data Interpretation • Pie Chart
Easy

Same directions as Q91

What was the percentage increase of category- employees in as compared to that in ?

Options
Show answer & solution

Option B

Approach

Find the number of category- employees in both years and take the percentage increase on the 2019 number.

Step-by-step solution

  1. 1

    Why: Same share of a bigger total.

  2. 2

    Why: Percentage increase is the rise divided by the old value.

Common mistakes

Option A

Divided the rise by the new value: . The base of an increase is the earlier value.

Option C

No common slip leads to this value; it sits on no natural wrong path.

Option D

No common slip leads to this value; it sits on no natural wrong path.

Skills used

Ideal time: about 1 min
94Statistics • Data Interpretation • Pie Chart
Moderate

Same directions as Q91

There are two categories of employees whose strength increased by same percentage in . What are the two categories ?

Options
Show answer & solution

Option D

and

Approach

Compute the percentage change of every category and find the two that are equal.

Step-by-step solution

  1. 1

    Why: has and .

  2. 2

    Why: has and .

  3. 3

    Why: These are not equal to each other or to .

Common mistakes

Option A

Saw at in both years and at and and judged them nearly equal. These are shares, not changes in employees.

Option B

No common slip leads to this value; it sits on no natural wrong path.

Option C

No common slip leads to this value; it sits on no natural wrong path.

Skills used

Ideal time: about 1.5 min
95Statistics • Data Interpretation • Bar Chart
Easy

Consider the following for the next four (04) items that follow :

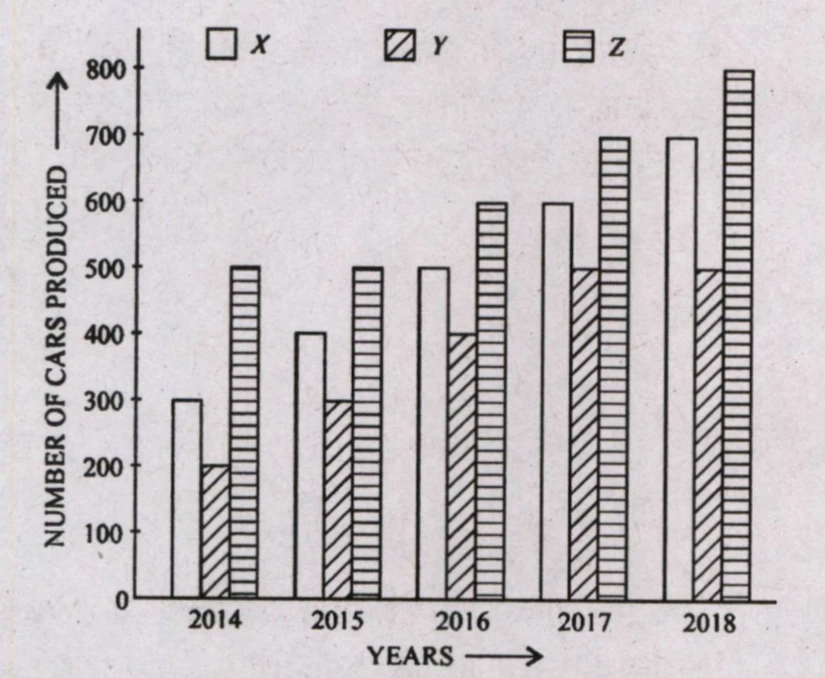
The following Bar-Chart gives the production of cars by three different companies , and in different years :

Grouped vertical bar chart. Y-axis 'NUMBER OF CARS PRODUCED' marked 0 to 800 in steps of 100; X-axis 'YEARS' with groups 2014, 2015, 2016, 2017, 2018. Three bars per year, keyed in a legend above the plot: X unshaded, Y hatched with diagonal lines, Z hatched with horizontal lines. Values read off the axis: 2014 X 300, Y 200, Z 500; 2015 X 400, Y 300, Z 500; 2016 X 500, Y 400, Z 600; 2017 X 600, Y 500, Z 700; 2018 X 700, Y 500, Z 800.

The percentage increase in the total production of cars from to was

Options
Show answer & solution

Option B

Approach

Add the three bars for each of the two years, then find the percentage increase.

Step-by-step solution

  1. 1

    Why: Read each bar off the vertical axis and add across companies.

  2. 2

    Why: The increase is divided by the earlier value.

Common mistakes

Option A

Divided the rise by the new total and got . The base should be the 2014 total.

Option C

No common slip leads to this value; it sits on no natural wrong path.

Option D

Gave the ratio and did not subtract the original .

Skills used

Ideal time: about 1 min
96Statistics • Data Interpretation • Bar Chart
Moderate

Same directions as Q95

Consider the production of each company separately. In how many instances was the percentage increase in production of cars over the previous year's production greater than ?

Options
Show answer & solution

Option A

Approach

Find each company's percentage rise year by year and count those above ; exactly does not count.

Step-by-step solution

  1. 1

    Why: Divide each rise by the previous year. Two years are above ; itself is not above .

  2. 2

    Why: Three years are above .

  3. 3

    Why: None is above .

  4. 4

    Why: Total count of instances.

Common mistakes

Option B

Counted one of the two rises of exactly as greater than .

Option C

Counted both rises of exactly as greater than .

Option D

No common slip leads to this value; it sits on no natural wrong path.

Skills used

Ideal time: about 2 min
97Statistics • Data Interpretation • Bar Chart
Moderate

Same directions as Q95

In which year was the percentage increase in production of cars minimum as compared to its previous year ?

Options
Show answer & solution

Option D

Approach

Add the three companies to get the yearly total, then find each year's percentage rise on the year before.

Step-by-step solution

  1. 1

    Why: Add the three bars of each year.

  2. 2

    Why: Each rise is divided by the previous year's total.

  3. 3

    Why: is the smallest.

Common mistakes

Option A

Looked at the rise in number of cars. The rise is in both 2015 and 2018, and the first of them was chosen.

Option B

No common slip leads to this value; it sits on no natural wrong path.

Option C

No common slip leads to this value; it sits on no natural wrong path.

Skills used

Ideal time: about 1.5 min
98Statistics • Data Interpretation • Bar Chart
Easy

Same directions as Q95

In one of the years the percentage increase in production of cars was minimum as compared to its previous year. What was the minimum percentage ?

Options
Show answer & solution

Option A

Approach

Take the minimum from the previous item, the 2018 rise on the 2017 total.

Step-by-step solution

  1. 1

    Why: The 2017 total is and the 2018 total is .

Common mistakes

Option B

An arithmetic slip in the fraction part: , not .

Option C

Divided by , the 2016 total, which is not the previous year of 2018.

Option D

Gave the percentage rise of 2015 or 2017, which is and not the minimum.

Skills used

Ideal time: about 1 min
99Arithmetic • Number System
Moderate

Consider the following for the next two (02) items that follow :

Collect all the sequences of five consecutive integers such that their product is equal to one of these integers. Let be the collection of all possible such sequences. Let be the smallest integer and be the largest integer occurring in these sequences.

How many such sequences of five consecutive integers are possible ?

Options
Show answer & solution

Option D

Five

Approach

A product of five consecutive integers is zero if the run contains , and if the run does not contain it can never equal one of its own numbers.

Step-by-step solution

  1. 1

    Why: The product is , and is one of the integers. All such runs qualify.

  2. 2

    Why: The five integers must include , so the smallest term is or . That gives five runs.

  3. 3

    Why: For the product to equal one of its numbers , divide by . Four different consecutive non-zero integers cannot all be , so their product is not .

  4. 4

    Why: Only runs containing qualify.

Common mistakes

Option A

Counted only the run centred on , .

Option B

Counted only the two runs that start or end at .

Option C

Counted only some of the runs containing and stopped early.

Skills used

Ideal time: about 2 min
100Arithmetic • Number System
Easy

Same directions as Q99

What is the arithmetic mean of and ?

Options
Show answer & solution

Option A

Approach

Use the runs from the previous item: the smallest integer is and the largest is .

Step-by-step solution

  1. 1

    Why: The smallest integer appears in and the largest in .

  2. 2

    Why: The mean of two numbers is their sum divided by ; it is the middle of the evenly spaced run .

Common mistakes

Option B

Used the run only, with and .

Option C

Used only the run , with and .

Option D

No common slip leads to this value; it sits on no natural wrong path.

Skills used

Ideal time: about 45 s